Planning

Recent News:
Regional Transportation Survey
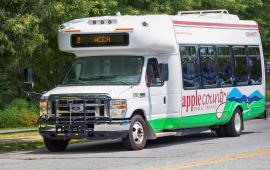
Please take the regional survey for future transportation projects and tell us about your priorities -- we want to know what is most important to you regarding our roads, greenways, sidewalks, and public transit! Click here to take the survey. Haz click aquí para realizar la encuesta. Please contact the French Broad River MPO for more information.
Survey: Above the Mud Greenway Project
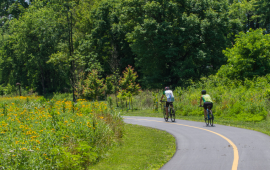
The City of Hendersonville and NCDOT are seeking your input on the 'Above the Mud' Greenway Feasibility Study. This greenway project is exploring a possible connection from the Ecusta Trail to the Oklawaha Greenway and 7th Avenue. Please take a few minutes to respond to this survey by April 30, 2024.
Take the Regional Hazard Mitigation Plan Survey
The South Mountains area is vulnerable to a wide range of natural and human-caused disasters that threaten the life and safety of residents and have the potential to damage or destroy property, disrupt the local economy, and impact the overall quality of life of individuals who live, work and vacation in the region. Henderson County, in coordination with other counties in the region, is working to update the Hazard Mitigation Plan.
Public input is an essential part of this plan. All interested residents are invited to participate in a survey to help the local governments develop the most effective and beneficial plan possible. Click here to learn more.
Our Mission: Plan growth to sustain and enhance the quality of life.
One of the duties of the Henderson County Planning Department is to provide staff support and technical assistance to the Planning Board, Technical Review Committee, Transportation Advisory Committee, Rail Trail Advisory Committee, and Historic Resources Commission. Planning staff also works with and assists other County Departments, governmental agencies, public officials, and the public.
The Planning Department, under the direction of the Board of Commissioners and supervision of the County Manager's Office:
-
Conducts studies and develops plans containing recommendations for the future development of the County;
-
Prepares ordinances intended to protect the public health, safety and welfare;
-
Administers regulations regarding the subdivision of land; and
-
Assists the public with questions on land use matters.